
Introduction
In social research, understanding the distribution of data is crucial for interpreting social phenomena accurately. Measures of central tendency (such as mean, median, and mode) provide a summary of the data, but they do not reveal how data points are spread out. Measures of dispersion help researchers assess the variability, inequality, and distribution patterns within a dataset.
From a sociological perspective, dispersion measures are essential for analyzing social inequality, economic disparities, educational attainment differences, and other key sociological variables. This article discusses four key measures of dispersion—Range and Mean Deviation, Standard Deviation, Quartile and Quartile Deviation, and Skewness—and their relevance in social research.
1. Range and Mean Deviation
Range
The range is the simplest measure of dispersion, calculated as the difference between the highest and lowest values in a dataset.

Sociological Application:
In social research, the range can highlight extreme disparities. For example:
- Income Inequality: If the highest income in a sample is $200,000 and the lowest is $20,000, the range ($180,000) indicates significant economic disparity.
- Educational Attainment: If years of schooling range from 0 to 20 in a community, the range helps assess educational inequality.
Limitations:
The range is highly sensitive to outliers. A single extreme value can distort the interpretation of variability.
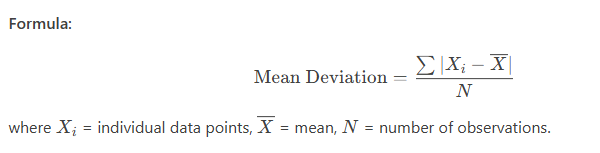
Mean Deviation (Average Deviation)
Mean deviation measures the average distance of each data point from the mean, providing a better sense of overall variability.
Sociological Application:
- Crime Rates: If crime rates in different neighborhoods deviate significantly from the mean, it suggests uneven law enforcement or socio-economic conditions.
- Health Disparities: Mean deviation in life expectancy across regions can indicate healthcare access differences.
Advantages Over Range:
Less affected by extreme values compared to the range.
Limitations:
Absolute values make it less suitable for advanced statistical analyses.
2. Standard Deviation
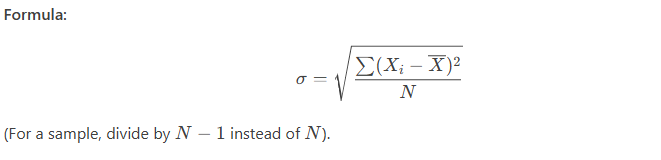
Definition and Calculation
The standard deviation (SD) is the most widely used measure of dispersion, representing the average distance of data points from the mean.
Sociological Application:
- Examining Social Stratification: A high SD in income suggests greater inequality (e.g., comparing SDs of income in capitalist vs. socialist economies).
- Public Opinion Research: A low SD in survey responses indicates consensus, while a high SD shows polarization.
Advantages:
- Considers all data points.
- Useful in inferential statistics (e.g., regression analysis).
Limitations:
- Sensitive to outliers.
- Assumes a normal distribution, which may not hold in real-world social data.
3. Quartiles and Quartile Deviation
Quartiles
Quartiles divide a dataset into four equal parts:
- Q1 (First Quartile): 25th percentile
- Q2 (Median): 50th percentile
- Q3 (Third Quartile): 75th percentile
Quartile Deviation (Semi-Interquartile Range)
Quartile deviation measures the spread of the middle 50% of data, reducing the impact of outliers.

Sociological Application:
- Urban-Rural Divide: Comparing Q1 and Q3 in household incomes can show economic disparities between urban and rural areas.
- Education Policy: If Q1 (25th percentile) of test scores is very low, policymakers may focus on improving education for underperforming students.
Advantages:
- Robust against extreme values.
- Useful for skewed distributions.
Limitations:
- Ignores variability outside the interquartile range (IQR).
4. Skewness
Definition
Skewness measures the asymmetry of a distribution:
- Positive Skewness: Tail on the right (mean > median).
- Negative Skewness: Tail on the left (mean < median).
Formula (Pearson’s Skewness Coefficient):

Sociological Application:
- Income Distribution: Most societies exhibit positive skewness—a few extremely rich individuals pull the mean above the median.
- Crime Data: If most areas have low crime rates but a few have very high rates, the distribution is positively skewed.
Implications for Social Research:
- Helps identify inequality patterns (e.g., wealth concentration).
- Guides policy interventions (e.g., progressive taxation to reduce income skewness).
Limitations:
- Requires a sufficiently large dataset for accurate interpretation.
- Does not indicate causality.
Conclusion
Measures of dispersion are indispensable in sociological research for understanding inequality, variability, and distribution patterns in social phenomena.
- Range and Mean Deviation provide basic insights but are limited by sensitivity to outliers.
- Standard Deviation is widely used in statistical modeling but assumes normality.
- Quartile Deviation is robust for skewed data, making it useful in economic and policy research.
- Skewness helps identify asymmetrical distributions, crucial for studying social stratification.
By applying these measures, sociologists can better analyze social inequalities, policy impacts, and group differences, leading to more informed decision-making in governance and social welfare programs.
Like this this Article ? You Can follow as on :-
Facebook – https://www.facebook.com/hubsociology
Whatsapp Channel – https://whatsapp.com/channel/0029Vb6D8vGKWEKpJpu5QP0O
Gmail – hubsociology@gmail.com